Wednesday 23rd June 2021: Technical Outlook and Review
On the weekly timeframe, pulled back lower and is testing key trendline pullback support at 1764. On the daily, price tested and reacted above 1764 weekly support.
Tuesday 22nd June 2021: Technical Outlook and Review
On the weekly timeframe, pulled back lower and is testing key trendline pullback support at 1764. On the daily, price tested and reacted above 1764 weekly support.

Monday 21th June 2021: Technical Outlook and Review
On the weekly timeframe, pulled back lower and is testing key trendline pullback support at 1764. On the daily, price pulled back lower, and is testing 1764 weekly support.
Friday 18 June 2021: Markets mixed as investors evaluate Fedspeak
The U.S. dollar index, which tracks the greenback against a basket of its peers, was at 92.009 following a recent climb from below 91.
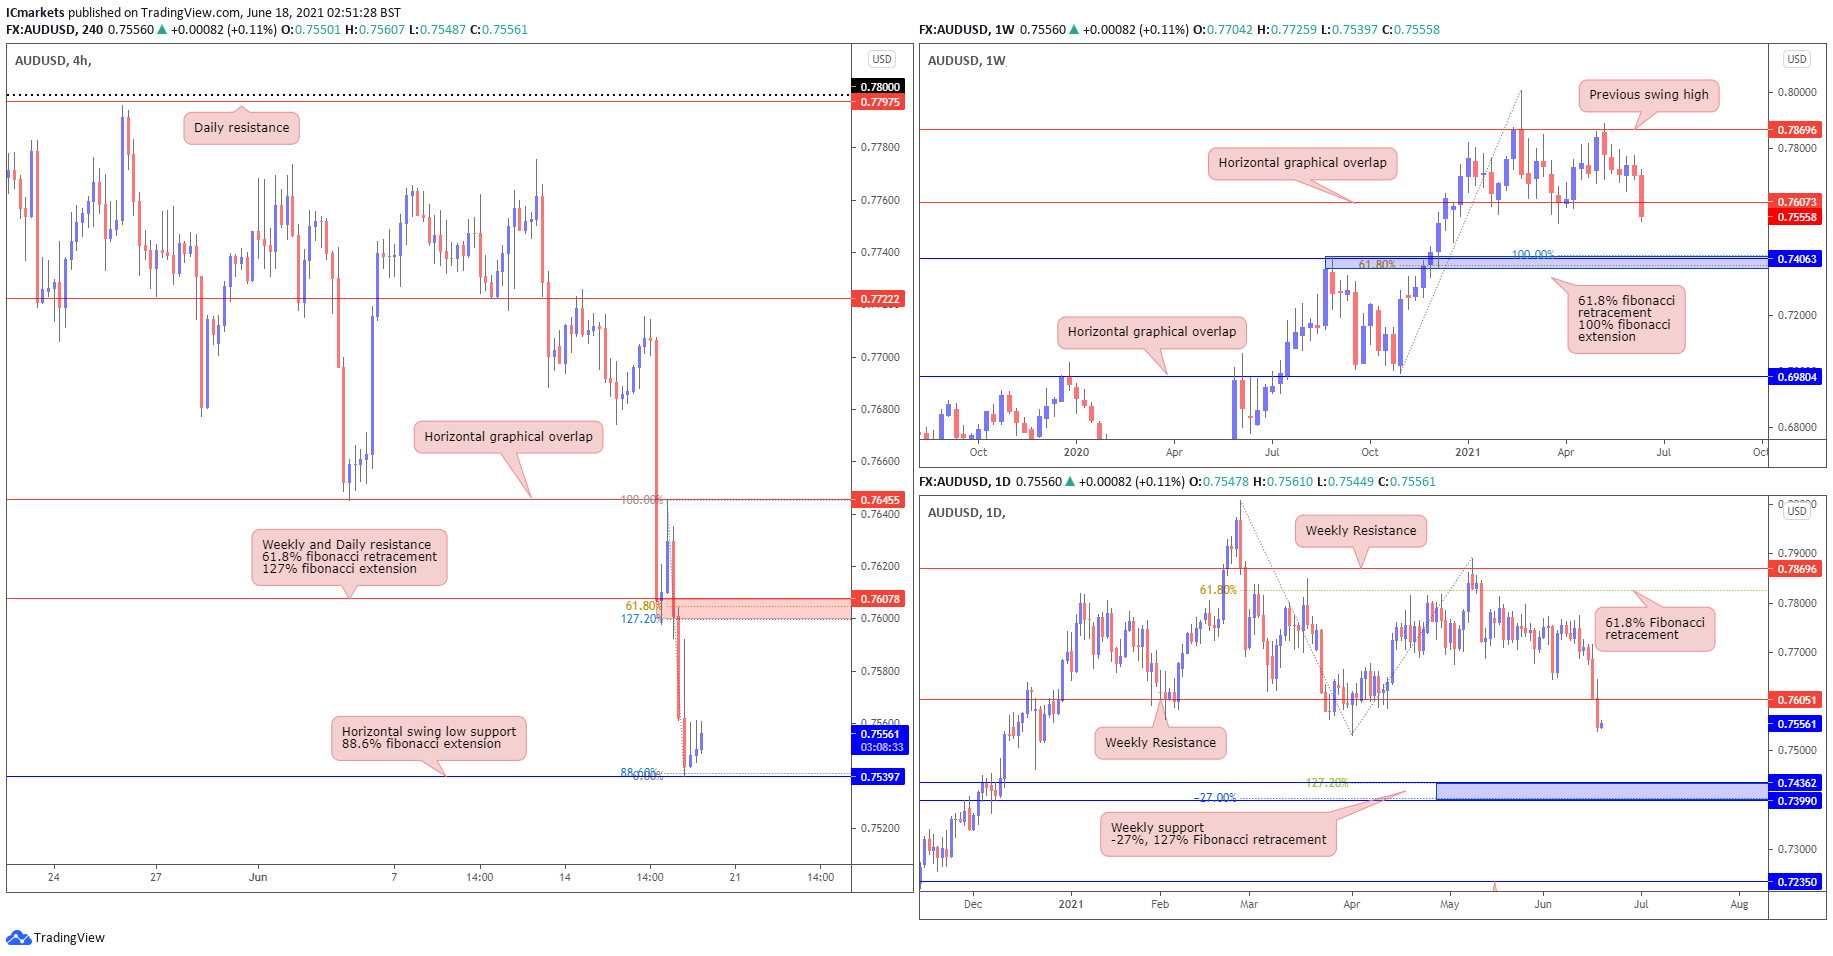
Friday 18 June 2021: Technical Outlook and Review
Looking at the weekly chart, we can see that prices have pulled back and found support at 1.39345, in-line with 23.6% Fibonacci retracement and ascending trendline support.

Thursday 17th June 2021: Technical Outlook and Review
On the weekly timeframe, prices are facing bullish pressure and could still see further upside, with 1965 as the weekly resistance target. On the daily, price pulled back lower, and is testing 1815 support, in line with the descending trendline resistance-turned-support.

Wednesday 16th June 2021: Technical Outlook and Review
On the weekly timeframe, prices are facing bullish pressure and could still see further upside, with 1965 as the weekly resistance target. On the daily, price pulled back lower, and is testing 1850 support.

Wednesday 28th April 2021: Technical Outlook and Review
On the weekly timeframe, gold is testing and holding below descending trendline resistance and long term moving average resistance at 1785.

Tuesday 27th April 2021: Technical Outlook and Review
On the weekly timeframe, gold is testing and holding below descending trendline resistance and long term moving average resistance at 1785.