More Option
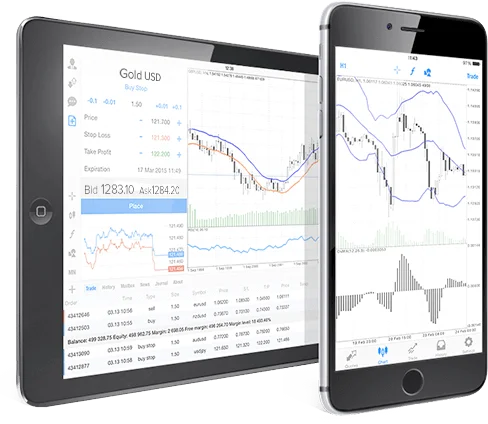
IC Markets offers a flexible and easy way to gain exposure to some of the world’s most popular commodities including energies and metals all from within your MetaTrader 4, 5 and cTrader trading platform.
Commodity markets are attractive to speculators as they are susceptible to dramatic changes in supply and demand.
Commodity CFDs
Facts
- Over 28 Commodities to trade
- Energy, Agriculture and Metals
- Spot and Futures CFDs
- Leverage up to 1:10
- Spreads from 0.0 pips
- Deep liquidity
Energies
IC Markets allows trading of spot energy contracts including Crude Oil, Brent, and Natural Gas from your MetaTrader 4 and 5 platforms against the US Dollar.
Trading energy contracts as a spot instrument has many advantages for investors who are only interested in price speculation.
Precious Metals
IC Markets allows trading the spot price for Silver against the US Dollar or Euro and the metals Platinum or Palladium against the US Dollar as a currency pair on 1:10 leverage and Gold against the US Dollar on 1:20 leverage.
Soft Commodities
In addition to energy and metal contracts, at IC Markets we offer a range of soft commodity products to trade, including corn, soybeans, sugar, cocoa, coffee, and wheat as CFDs – all with low spreads and leverage up to 1:10.

How does Commodities trading work?
Commodities cover energy, agriculture and metals products. These products are traded in futures markets and derive their value from demand and supply characteristics.
Supply characteristics include the weather in the case of agriculture and costs of extraction in the case of mining and energies.
Demand for commodities tends to be characterised by broader conditions such as economic cycles and population growth. Commodities can be traded as stand alone products or in pairs.
Metals and energies are traded against major currencies whereas agriculture futures contracts are traded as stand-alone contracts.
Commodity trading example
Buying: Wheat
The gross loss on your trade is calculated as follows:
Opening Price
Closing Price
Gross Loss on Trade
Opening the Position
Wheat_N7 is currently trading at 434.00/435.25 and you are expecting Australia’s East Coast crops to be affected by adverse weather patterns over the coming year which will result in lower than average crop yields.
You buy 100 contracts of Wheat (4 bushels per contract) at 435.25 which equals USD $174,100 (435.25 * 100 * 4).
Closing the Position
Your research surrounding weather conditions turns out to be wrong. Higher crop yields this year have caused Wheat prices to decrease to 410.50/412.15. You exit your position by selling your contracts at 410.50.
The gross profit on your trade is calculated as follows:
Opening Price
Closing Price
Gross Profit on Trade
Opening the Position
Wheat_N7 is currently trading at 434.00/435.25 and you are expecting Australia’s East Coast crops to be affected by adverse weather patterns over the coming year which will result in lower than average crop yields.
You buy 100 contracts of Wheat (4 bushels per contract) at 435.25 which equals USD $174,100 (435.25 * 100 * 4).
Closing the Position
Your research surrounding weather conditions turns out to be correct. Lower crop yields this year have caused Wheat prices to increase to 460.00/462.15. You exit your position by selling your contracts at 460.
Spreads
Commodities